
")
One of the most common mistakes social sellers make when setting revenue goals is assuming demand is evenly distributed throughout the year.
It is not. Earnings in social commerce are highly seasonal, and ignoring that reality leads to distorted targets, poor resource allocation, and unnecessary stress.
Top sellers use seasonality data not as background context, but as a core input into forecasting and goal construction.

They model expectations by quarter, adjust effort accordingly, and evaluate performance relative to historical patterns rather than short-term fluctuations.
Seasonality turns goal-setting from guesswork into planning.
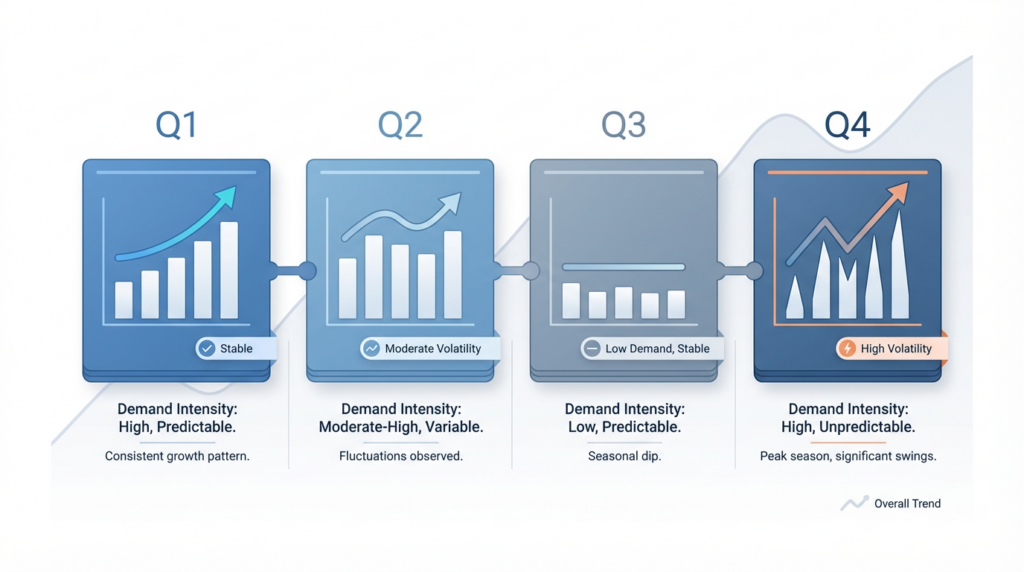
Q1: Establishing a True Baseline Using Low-Demand Data
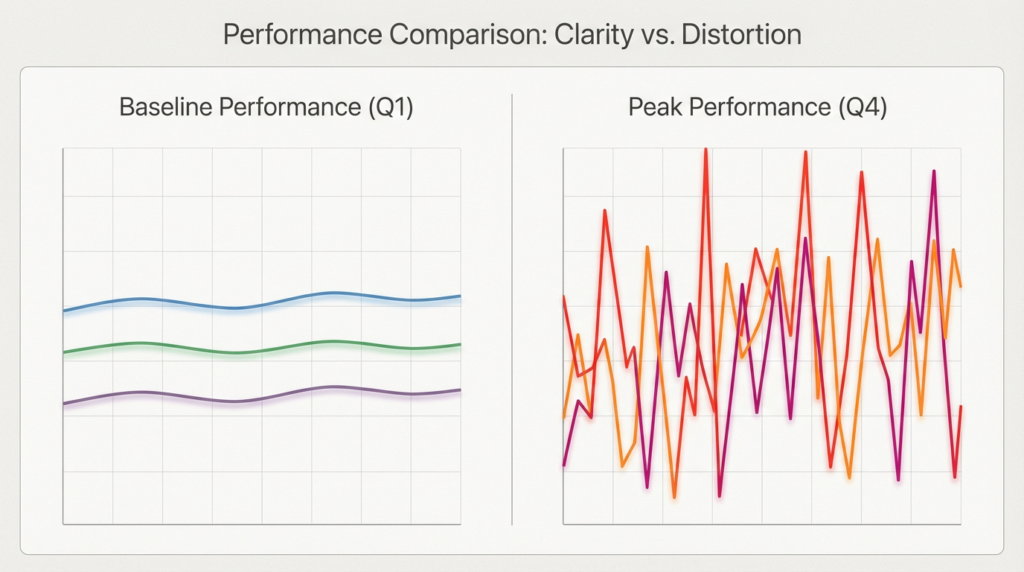
Q1 provides the cleanest data of the year. Demand is lower, promotional pressure is minimal, and impulse buying declines. This makes Q1 performance especially valuable for analytics.
Top sellers use Q1 data to calculate their actual baseline earnings, which their business generates without urgency, discounts, or event-driven demand.
This baseline is more reliable than Q4 averages and more honest than monthly highs.
Key analytics reviewed in Q1 include:
- Conversion rate stability across products
- Revenue concentration: how much income depends on the top 1–3 products
- Category performance without seasonal lift
- Average order value consistency
This data informs realistic annual planning. If revenue collapses in Q1, the issue is not seasonality alone; it indicates overreliance on peak-driven products or formats.
Use Q1 to recalibrate annual goals downward if necessary. Inflated targets built on peak months almost always fail.
Q2: Identifying Growth Drivers and Assigning Revenue Responsibility
In Q2, demand begins to normalize. This is where top sellers stop asking “Are sales up?” and start asking “What is causing growth?”
They break revenue down by:
- Product
- Category
- Content format
- Traffic source (where available)
Instead of setting a single quarterly revenue goal, they assign specific growth expectations to different segments.
For example, evergreen categories are expected to stabilize income, while seasonal categories are expected to contribute incremental growth.
This prevents overestimating scalability. Not all products can grow at the same rate, and analytics makes that visible.
Use Q2 data to identify which categories deserve increased effort and which should remain maintenance-only.
Q3: Using Historical Comparisons to Forecast Q4 Performance
Q3 is the most crucial quarter for predictive analytics.
Top sellers compare Q3 performance against historical Q4 outcomes to understand lead indicators. They analyze:
- Time lag between content publication and peak conversion
- Whether products that performed well in Q3 also performed in prior Q4s
- Conversion efficiency trends, not just volume
This allows sellers to forecast Q4 with greater accuracy. Rather than projecting “best-case” scenarios, they model outcomes based on historical relationships between Q3 and Q4 data.
Set Q4 goals before Q4 begins, using Q3 data as the primary input. Avoid revising targets mid-quarter.
Q4: Measuring Execution Against Predefined Benchmarks
Q4 is not a planning quarter. It is an execution quarter.
Top sellers enter Q4 with benchmarks already defined:
- Minimum acceptable conversion rates
- Expected revenue per product
- Acceptable return and refund thresholds
- Daily and weekly performance ranges
They evaluate performance relative to these benchmarks, not emotional expectations. Products that fall below thresholds are deprioritized quickly.
New experiments are limited because testing during peak competition introduces unnecessary risk.
Do not introduce unvalidated products or formats in Q4 unless data already supports them.
Accounting for Time Lag in Goal Measurement
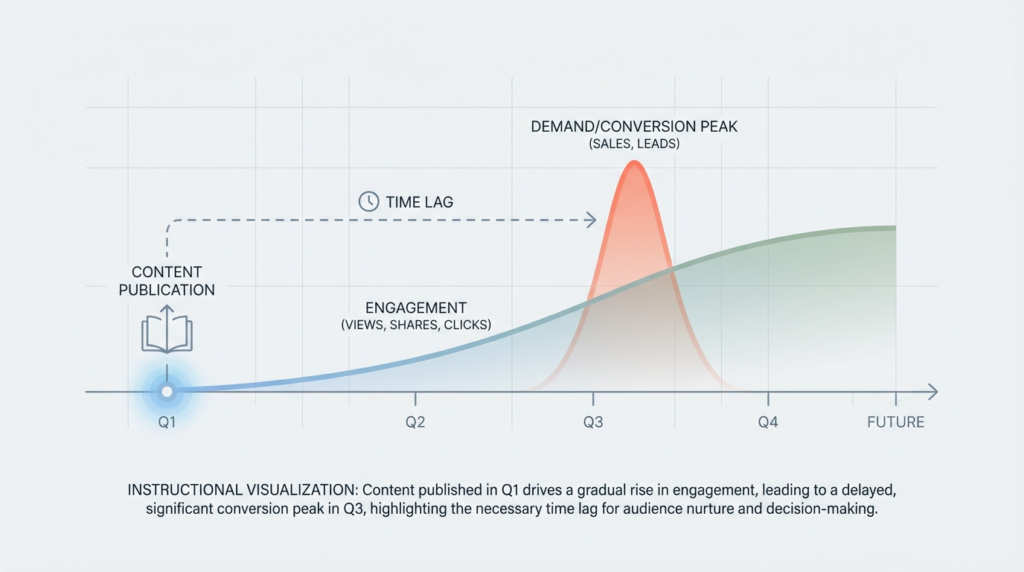
A critical analytical factor often overlooked is conversion lag. Sales rarely occur immediately after content is published. Research, comparison, and repeated exposure introduce delays that vary by category and price point.
Top sellers account for this by:
- Measuring performance over rolling windows instead of single days
- Evaluating content effectiveness weeks after publication
- Avoiding early conclusions during peak periods
Publishing earlier in the cycle produces more reliable data because signals stabilize before demand peaks.
Avoid judging performance during peak weeks alone. Use pre-peak and post-peak data to assess actual effectiveness.
How Seasonality Changes Goal Structure
Creators who double their earnings do not write goals as single annual targets. They structure goals by quarter, with different objectives:
- Q1: baseline validation and risk reduction
- Q2: controlled growth
- Q3: forecasting and selection
- Q4: execution and yield maximization
This structure reduces volatility and improves accuracy. Goals become measurable, time-bound, and aligned with actual demand patterns rather than optimism.
In 2026, the advantage is not working harder during peaks.
It is setting goals that reflect how demand actually behaves.


